So it’s almost Christmas, nearly a week to go. So in the spirit op Christmas I want to share something with you. People how know me know I love speed. Not the drugs you silly ;-). No, I love the speed of acceleration, the faster the better. That’s why I am a “Speed Junky”. In my free time I get high on snowboarding or going downhill on my Enduro bike. The main reason for this is adrenaline, and let’s not forget the focus for doing this. One single mistake and you are……Well fill in the blanks.
What about Magento and Speed
Working with Magento nearly 10 years I have seen many many Magento shops. Some are really fast but the majority is, excuse my language “crap”.
Some blame Magento, some say it’s the Hosting while outer says it’s the theming with the associated modules.
Well this Christmas stories is not to start a discussion on who’s to blame but what we can do about this! One thing I like to share on this debate is, if you do it right, Magento can performance easily under a second.
So it’s back to the basics and they are very easy, it’s called awarness. Being aware of the performance from your Magento shop is one of the most important elements out there. This can be managed by everybody, not only a technical person in your team. Awareness is the key to success.
Magento Performance Monitoring for Dummies
- First rule of “Awareness” is: Start monitoring your Magento shop
- Second rule is: Start reporting
- Third rule: Send an alert when something is wrong
And this can be done while enjoying your Christmas Holiday’s form your rocking chair with a glass of eggnog.
To keep it “Dummy” proof I love to share some snippets of code who loves to start playing with is.
Easy steps for a peaceful Christmas:
1) Setup a VPS (tip: start with a 4GB mem, 2CPU setup)
2) Install Docker + Docker Compose
wget -qO- https://get.docker.com/ | sh
curl -L "https://github.com/docker/compose/releases/download/1.17.1/docker-compose-$(uname -s)-$(uname -m)" -o /usr/local/bin/docker-compose
chmod +x /usr/local/bin/docker-compose
3) Download Sitespeed.io docker-compose.yml (pick a spot on your machine, example: /var/www)
wget https://raw.githubusercontent.com/sitespeedio/sitespeed.io/master/docker/docker-compose.yml
4) Run Docker compose
cd /var/www
docker-compose up
5) Wait until all Docker containers have been downloaded and active
You can test it with:
docker ps -a
6) All done, now lets setup a crontab so we can start monitoring
*/5 * * * * cd /var/www && /usr/local/bin/docker-compose run sitespeed.io https://example.com/ -n 1 --speedIndex --graphite.host=graphite >> /tmp/sitespeed-output.txt 2>&1
This is an example which runs evert 5 minutes. Change the URL to monitor yours. Run multiple cron rule with different urls if you like, but change the crontab times, only 1 docker can run at a time.
7) Open up a browser, and fire up the Christmas tree. Use you VPS ip and add port 3000 at the end, like this:
http://11.22.33.44:3000
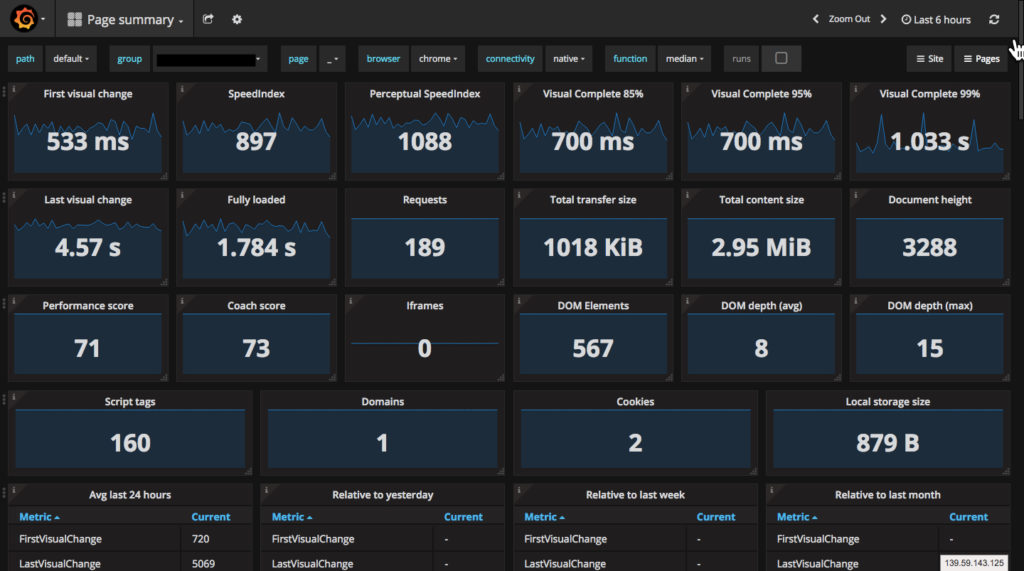
Now lets display this via your “Chromecast” to your big screen tv and start enjoy your eggnog while watching the numbers coming in.
Third rule of Awareness: Alerts
The beste Christmas gift this year is the “Alert Notifications” mode of Grafana. So you can easily enjoy your eggnog and only getting notified when something is wrong. Grafana has multiple notification channels like, mail, PagerDuty, HipChat, web hooks, slack and much much more. For this setup we use Slack.
Now let’s login in to our dashboard in the top left corner. The username/password can be found in your docker-compose.yml file. For security reason I am not sharing them here, and don’t forget to change them.
Next go to Dashboards > New (http://11.22.33.44:3000/dashboard/new), select “Graph” and click on the title “Panel Title” to edit.
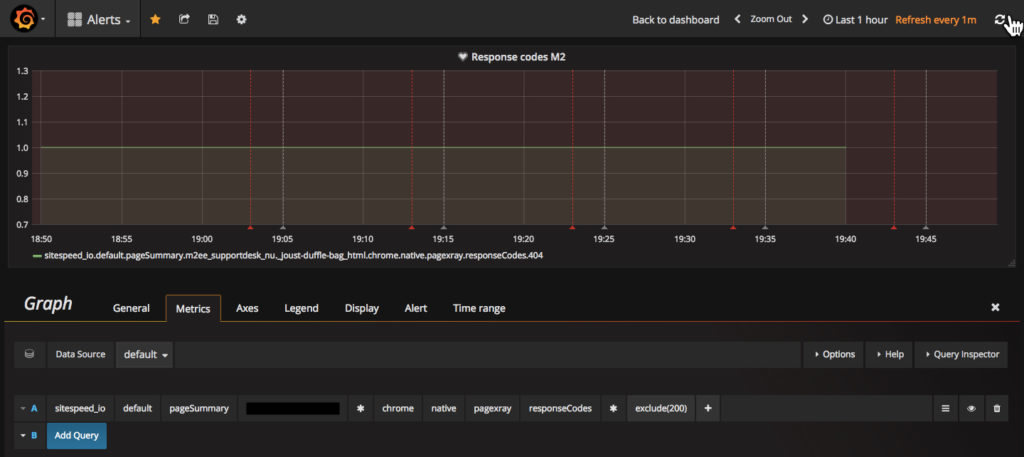
Change the title name in the tab “General” and add the following query in the “Metrics” tab.
For this example we would like to start monitoring any response code excluded “error 200” on the submitted pages in the cron. So we like to see any 404 or 5xx popping up and send a report to our Slack channel.
sitespeed_io || default || pageSummary || example.com || * || chrome || native || pagexray || repsonseCodes || * || exclude(200)
ps. replace example.com with you URL
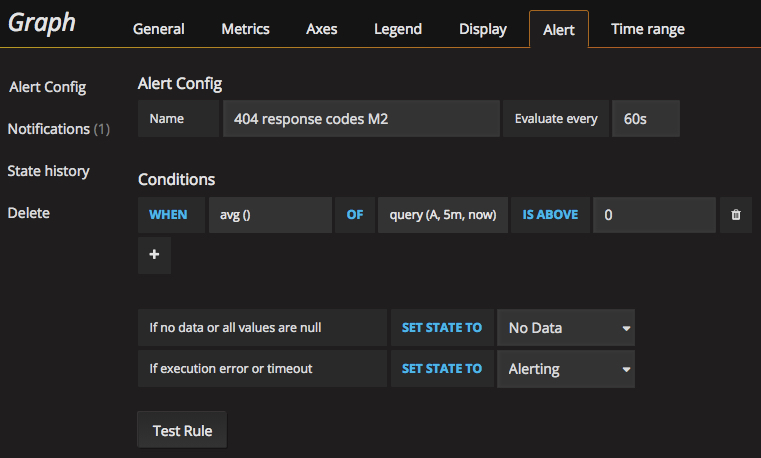
Next go to the tab “Alert” and submit the following.
Name: 404, 5xx response
Evaluate every: 60s
Conditions: WHEN avg() OF query(A, 5m, now) IS ABOVE 0
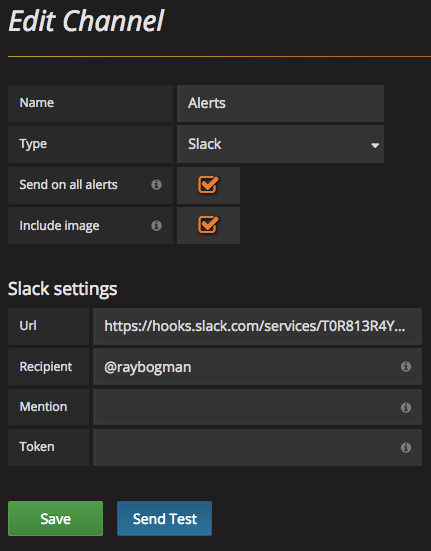
Now save the new Dashboard with the title “Alerts”. And goto the “Alerting” menu and pick “Notification channels” > New Channel and submit the following.
Name: Slack
Type: Slack
Send on all alerts: check
Include Images: check

Url: https://hooks.slack.com/services/TASDFas/asd3sdfasd/asdfWEsdFasEesdf
Recipient: pick a channel
And “Send Test” and “Save”. Now goto you slack account and check in the selected channel for an alert message.
ps. don’t forget to setup your Slack incoming profile before you begin. (https://example.slack.com/apps/A0F7XDUAZ-incoming-webhooks)
This example alert is just the beginnen of something beautiful. you can query everything, from SpeedIndex to Css changes, from Google Pagespeed scores to pagesize and create a single alert depending on the threshold you have set.
……Well fill in the blanks
In the beginning of the article I have shared my personal pasion on speed. As you have been reading along the rest of this article the same goes for the Magento speed. You have to keep focused on the performance of your shop, it all can be gone at a blink of a eye. A couple of heavy releases could be fatal for future performance if you are NOT aware on whats going on. I have seen Magento frontend pages which weigh more than 6mb during “Blackfriday”, WTF! The loadtimes on those pages was more than 10 seconds on a mobile device. And then getting question from a new client why the server crashes while sending a large mailing list Arggggg……
Mage.coach
For folks out-there who don’t have the time or patience to setup a server, don’t worry! Try out Mage.coach, it’s a SaaS based version of Sitespeed.io. Currently it’s without the cool dashboards and alerts, but maby a new feature to put on the roadmap for 2018 😉
Sources:
http://docs.grafana.org/alerting/notifications/
https://mage.coach/
https://run.mage.coach/
https://www.sitespeed.io/


